Real Stores, Real Results
Numbers don't lie. Here are the measurable outcomes from our mobile UX transformations across fashion, electronics, beauty, and grocery verticals.
Start Your Case Study →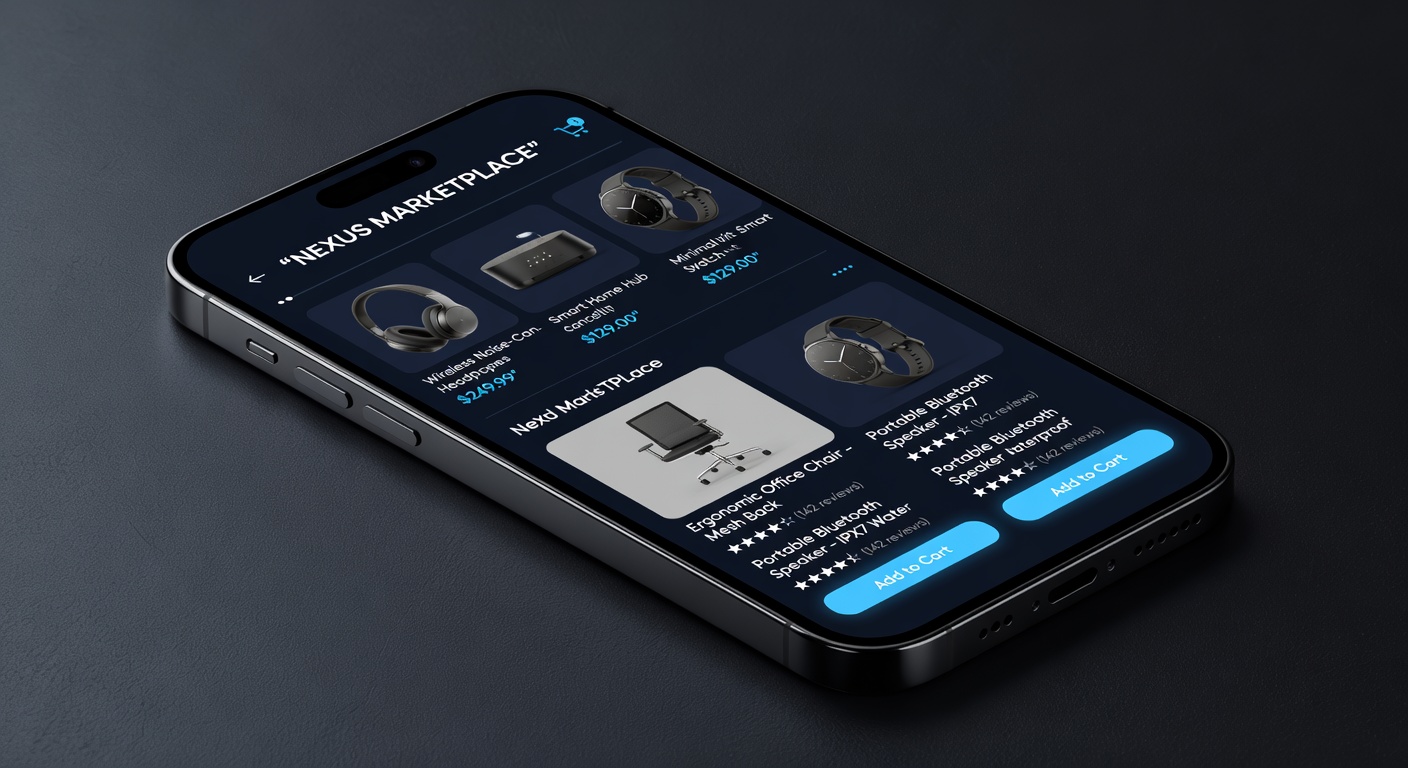 Fashion
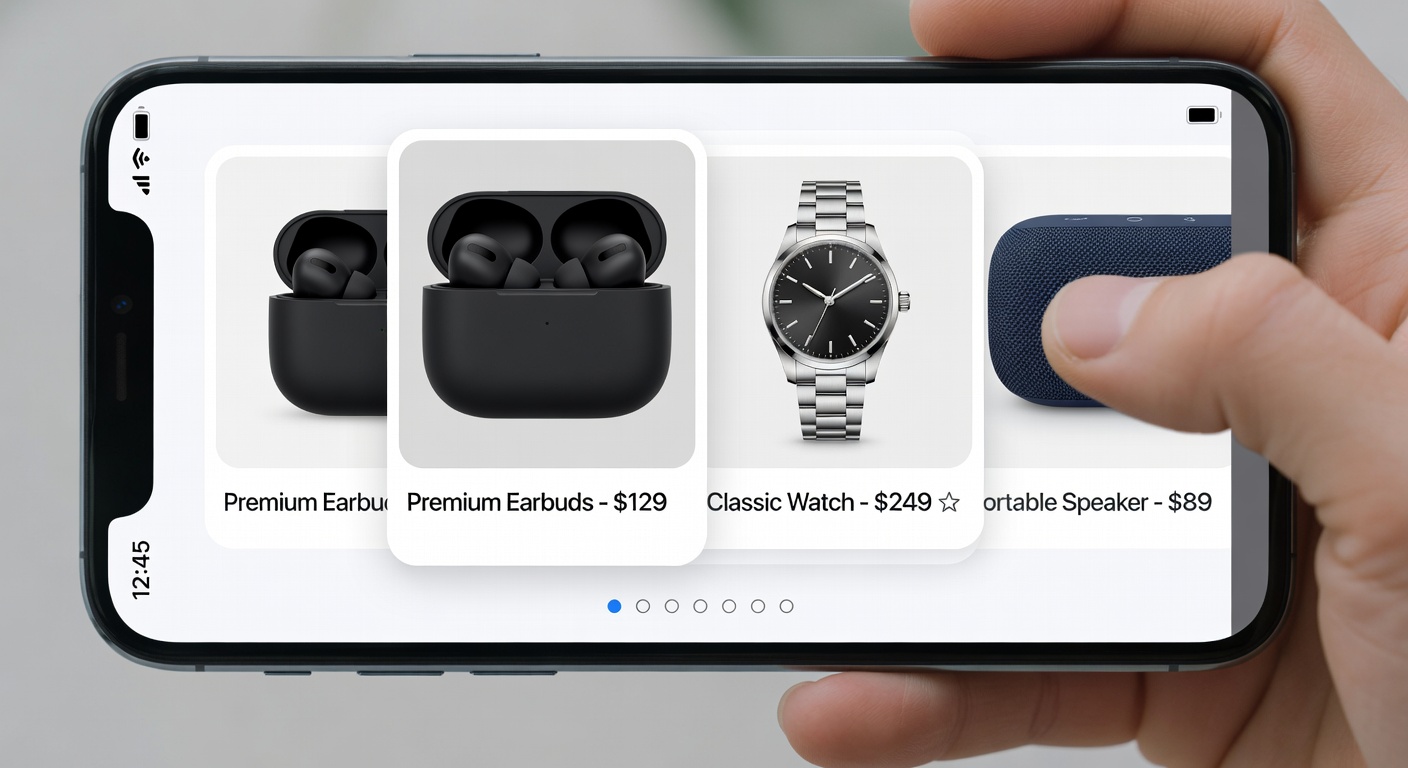
Redesigning mobile browsing for a 12-million-item fashion catalog
Noda's mobile site had a 91% bounce rate on product listing pages. Users couldn't navigate the catalog, filter options were hidden in a hamburger menu, and load times averaged 6.2 seconds on 4G. We rebuilt the entire mobile experience from the ground up in 12 weeks.
 Electronics
Rebuilding product discovery for high-consideration electronics purchases
Electronics buyers need to compare specs, read reviews, and zoom into product details. Akihabara's previous mobile site collapsed spec tables to illegible single-column formats. We redesigned the PDP around horizontal swipe comparison and thumb-optimized spec tables.
Across all 200+ mobux projects
These are average improvement metrics across all client projects completed between 2021 and 2026. Results vary by vertical, starting baseline, and scope of work.
| Metric | Avg. Before | Avg. After | Improvement |
|---|---|---|---|
| Mobile Conversion Rate | 1.2% | 3.4% | +183% |
| Cart Abandonment Rate | 82% | 61% | −21pp |
| Page Load Time (LCP) | 5.8s | 1.9s | −67% |
| Mobile Revenue Share | 34% | 58% | +24pp |
| Checkout Completion | 22% | 54% | +145% |
| Average Session Depth | 2.1 pages | 4.8 pages | +129% |
"mobux completely changed how we think about our mobile store. We went from treating mobile as a scaled-down desktop site to building native experiences that our customers love. The conversion results speak for themselves."
👤Kenji WatanabeHead of Digital, Noda Apparel
"The checkout redesign alone paid for the entire mobux engagement in 6 weeks. Our mobile revenue went from an embarrassing 28% to over 60% of total sales."
👤Yuki TanakaCTO, Akihabara Direct